
When it comes to website performance, very few tools are available but thankfully they are so good. Thanks to Google to bringing a norm on how we should at performance of page, and how we can put a metric around it. As you already know Google has setup few metrics, called Web Vitals, which tells us how performant a webpage is. Of these metrics, there are few main ones called as Core Web Vitals which are high priority deciding factors.
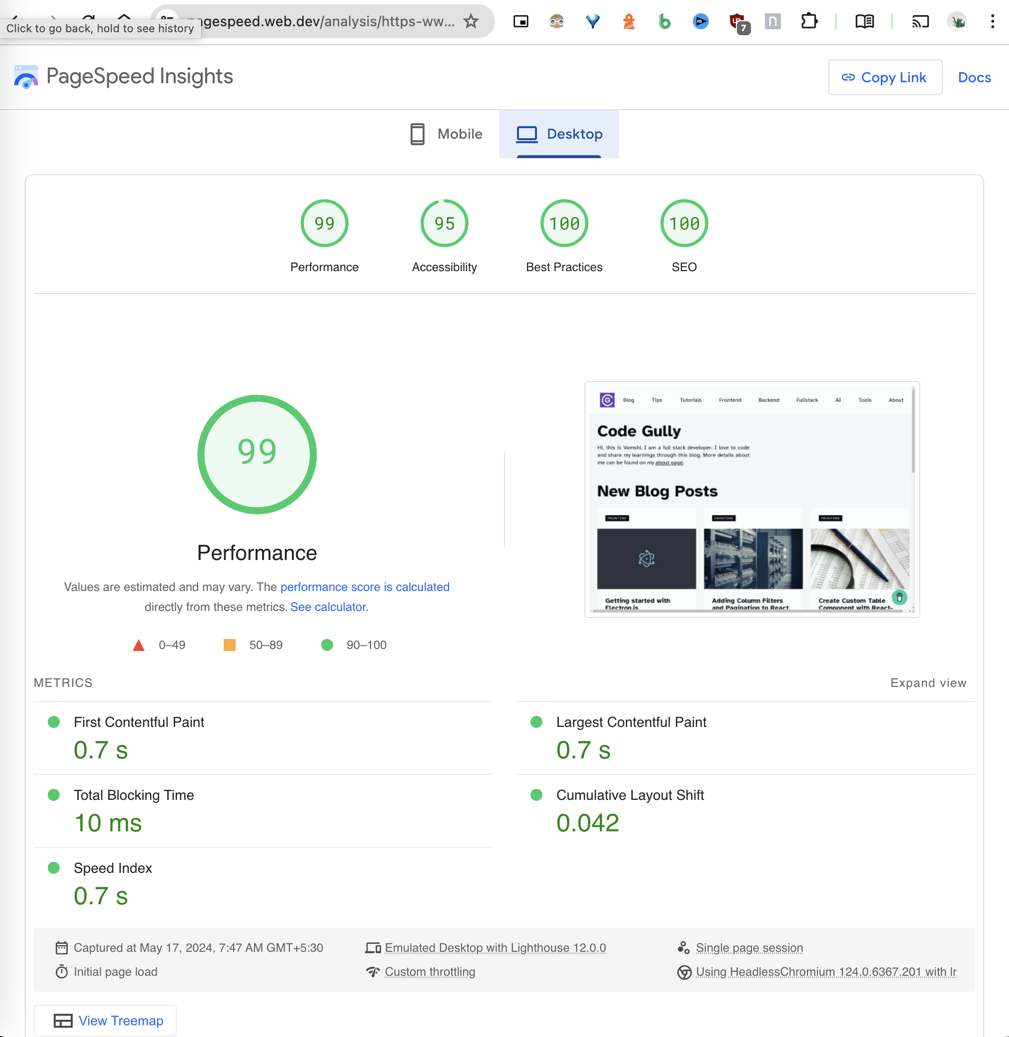
Before diving into this, want to showcase the performance scores of this blog.
Core Web Vitals Introduction
LCP - Largest Contentful Paint - This refers to the time taken for the content to render in the view port that makes sense for the user to go through.
FID - As you know, a lot of functionality is pushed to frontend causing the JavaScript bundles to blow up in size. Due to this execution will take time, and as JavaScript is single threaded, it gets locked with that execution and cannot react to the user clicks or interactions. This measures the duration taken by user interaction recognized - hence First Input Delay. NOTE: This is replaced by INP - Interaction to Next Paint - making it a more continuous metric than FID which focuses on the first interaction.
CLS - Cumulative Layout Shift - indicates how your elements are moved around during the page loading process. An example scenario would be - if a user is about to click a button, but due to some other elements rendering it moved to elsewhere, the click might happen on some random element - which is bad UX.
Quantifying performance
Now that we know what are the main metrics, how do we measure them? Because without having a measurement, we don’t know if at all an improvement is present. Isn’t it?
Thanks to Google again, for providing Lighthouse - a standard tool to measure these web vitals. It also provides the steps with very fine details on how we can fix the issues affecting different web vitals. Lighthouse is also available as a chrome extension, and also as a CLI tool which you can use to integrate into your build pipelines and track the performance over a period. If you want to offload this task, you can use a service like GTMetrix to monitor the performance by running this performance test in scheduled way.
If your website is deployed, you can take help of PageSpeed Insights to run it on real devices across the world, and capture the performance details.
Performance Improvement techniques
A comprehensive list of tasks that you can do to achive best scores in Web Vitals are below:
Handling images
This is a very low hanging fruit in case you want to improve performance. Take care of these things when you have images on your website.
-
Avoid oversized images usages by having different images for Mobile, Tablet and Desktop resolutions - and load the right image using srcset in Picture element, or media queries etc.
-
Once you have the right resolution, try to compress the image - this is done by various tools available - what they generally do is remove any unnecessary attributes on the image metadata, optimize quality etc.
-
Convert images to WebP format which has better compression than others
-
See if you can lazy load images which fall outside the viewport on initial load - that way you aren’t requesting for images which the user may or may not see.
-
As it’s an image, and probably won’t be changing forever, you could use very high cache-ttl duration to cache the image on user browsers for longtime.
-
Also ensure that you are registering the right sizes on the page (width, height) for the images. So that the overall layout doesn’t get disturbed when the images are loading.
Free up JavaScript thread
As your website gets bigger, you might be pushing a lot of JavaScript code that can render the UI elements, provide animations, etc. But you don’t want to load all the code in the initial load only. This will cause the JavaScript thread busy on the execution, and user interactions cannot be caught by the browser. We could use following to improve performance by doing the following
-
Chunkify the code bundles and load only the necessary JavaScript bundle - that way your thread will free up in between and react to user interactions.
-
Judge whether this code is needed during the load. If not, we could use onload event, and try to delay the request to fetch those bundles.
Others
-
Check if you are using any external fonts and see if you can host them, which can help reduce time in the network handshakes, and you have complete control so that you can use cache headers to cache the fonts in the user browser for really longtime.
-
From accessibility point of view, see if you have the text and background have the right contrast to easily read through. You can take help of contrast checkers and modify the colors accordingly to improve.
-
If you have any hidden elements that pop up during page rendering - ensure that there is space allocated for them so that they won’t disturb the existing layout or elements already arranged on the page.
-
From Best Practices point of view - see if you have the right ordering of the elements like h1 should appear before h2, paragraph cannot have div element as child etc.
This is my blog’s detailed report. I keep working as I get time to improve it’s performance. Please do share your thoughts, and reach out if you are interested to know about your website performance.
Monitoring
Coming to monitoring and getting insights on when the performance degraded, as mentioned earlier, you could integrate Lighthouse CLI tool into your build pipleines, and keep track of those metrics. Also, you can use services light GT Metrix to run scheduled performance tests and raise fine-grained alerts whenever the related performance metric goes down.
Hope these details helped you understand the high priority performance improvements. Thanks for reading. Follow for more.